Plotting Utilities
This module contains a number of utility functions for plotting data.
plot_curvature
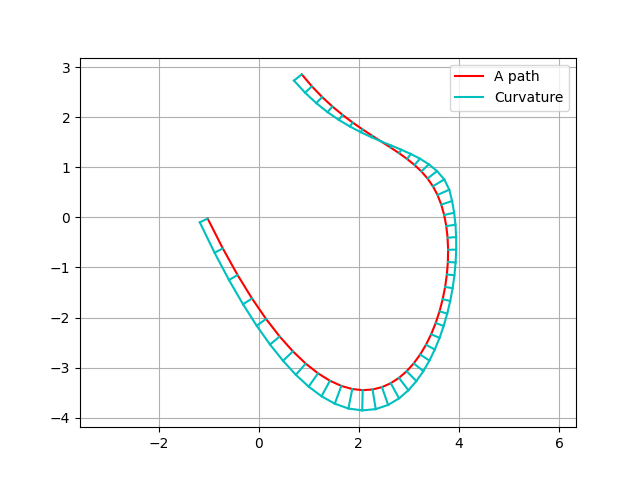
- utils.plot.plot_curvature(x_list, y_list, heading_list, curvature, k=0.01, c='-c', label='Curvature')[source]
Plot curvature on 2D path. This plot is a line from the original path, the lateral distance from the original path shows curvature magnitude. Left turning shows right side plot, right turning shows left side plot. For straight path, the curvature plot will be on the path, because curvature is 0 on the straight path.
- Parameters:
x_list (array_like) – x position list of the path
y_list (array_like) – y position list of the path
heading_list (array_like) – heading list of the path
curvature (array_like) – curvature list of the path
k (float) – curvature scale factor to calculate distance from the original path
c (string) – color of the plot
label (string) – label of the plot