Normal Distance Transform (NDT) map
This is a NDT mapping example.
Normal Distribution Transform (NDT) is a map representation that uses normal distribution for observation point modeling.
Normal Distribution
Normal distribution consists of two parameters: mean \(\mu\) and covariance \(\Sigma\).
\(\mathbf{X} \sim \mathcal{N}(\boldsymbol{\mu}, \boldsymbol{\Sigma})\)
In the 2D case, \(\boldsymbol{\mu}\) is a 2D vector and \(\boldsymbol{\Sigma}\) is a 2x2 matrix.
In the matrix form, the probability density function of thr normal distribution is:
\(X=\frac{1}{\sqrt{(2 \pi)^2|\Sigma|}} \exp \left\{-\frac{1}{2}^t(x-\mu) \sum^{-1}(x-\mu)\right\}\)
Normal Distance Transform mapping steps
NDT mapping consists of two steps:
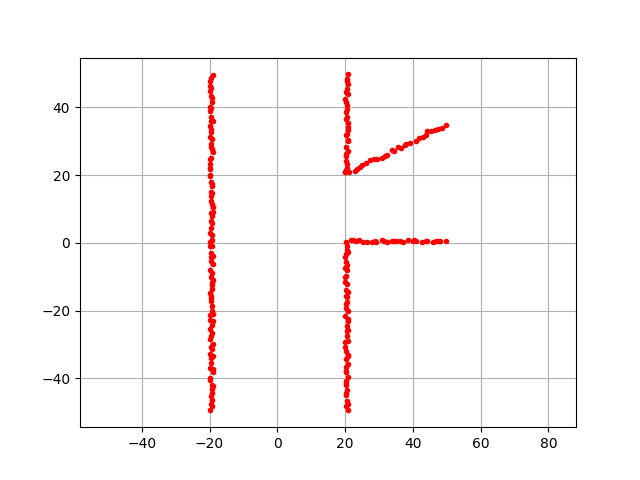
When we have a new observation like this:
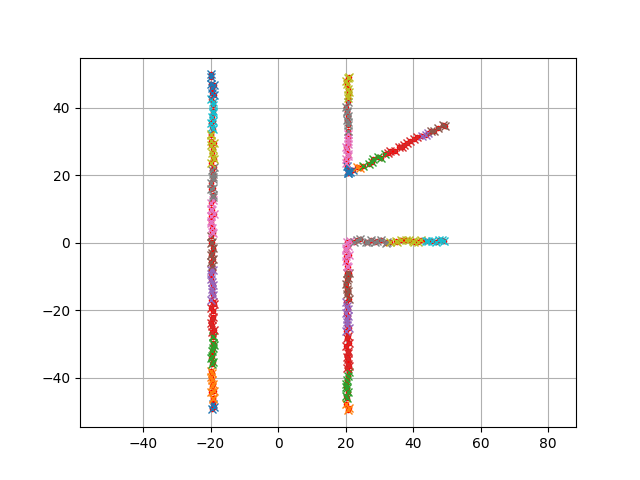
First, we need to cluster the observation points. This is done by using a grid based clustering algorithm.
The result is:
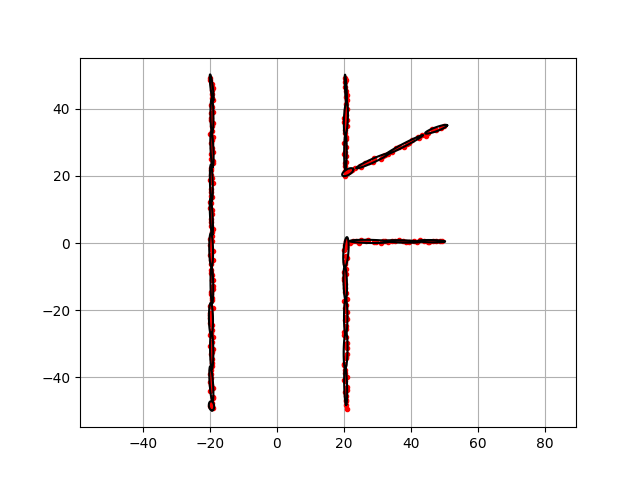
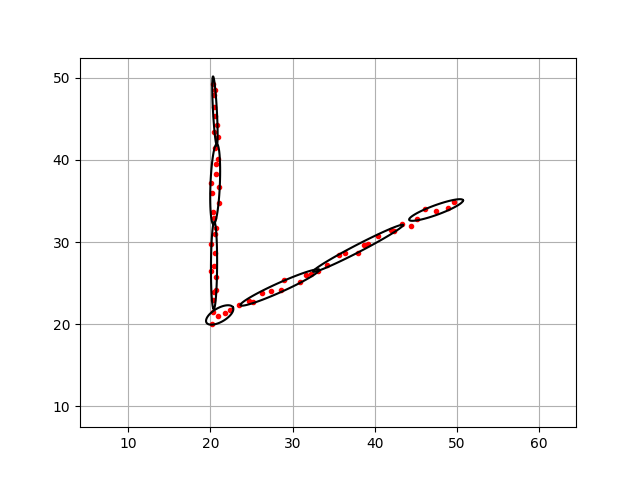
Then, we need to fit a normal distribution to each grid cluster.
Black ellipse shows each NDT grid like this:
API
- class Mapping.ndt_map.ndt_map.NDTMap(ox, oy, resolution)[source]
Normal Distribution Transform (NDT) map class
- Parameters:
ox – obstacle x position list
oy – obstacle y position list
resolution – grid resolution [m]
- class NDTGrid[source]
NDT grid
- center_grid_x
Center x position of the NDT grid
- center_grid_y
Center y position of the NDT grid
- covariance
Covariance matrix of the NDT grid
- eig_values
Eigen values of the NDT grid
- eig_vec
Eigen vectors of the NDT grid
- mean_x
Mean x position of points in the NDTGrid cell
- mean_y
Mean y position of points in the NDTGrid cell
- n_points
Number of points in the NDTGrid grid
- grid_index_map
NDT grid index map
- min_n_points
Minimum number of points in the NDT grid
- resolution
Resolution of the NDT grid [m]